- Introduction
- 1. Background
- 2. Retrieving sequences
- 3. Sequence alignment
- 4. Distance-based analyses
- 5. Recombination
- 6. Maximum likelihood based analyses
- 7. Visualising trees
- 8. Time-stamped phylogenies
- 9. Bayesian reconstruction of time trees
- 10. Effective population size estimation
- 11. Structured populations
- 12. References
- Published with GitBook
Practice
Load libraries
library(ape)
library(ggplot2)
library(ggtree)
library(phylobase)
Read in tree
read.tree is used to read in a Newick formatted tree.
tr <- read.tree("mers_subtree.tre")
tr
##
## Phylogenetic tree with 9 tips and 8 internal nodes.
##
## Tip labels:
##     KM027258_Human_2014/04/12, KM027255_Human_2014, KM027261_Human_2014/04/15, KM027259_Human_2014/04/14, KM027256_Human_2014, KM027260_Human_2014/04/21, ...
## Node labels:
##     1.0, 1.0, 0.9876111111111111, 0.1333888888888889, 0.9997222222222222, 0.1065, ...
##
## Rooted; includes branch lengths.
Let's look closer at the tree object.
names(tr)
## [1] "edge" "Nnode" "tip.label" "edge.length" "node.label"
tr$edge
##       [,1] [,2]
##  [1,]   10   11
##  [2,]   11   12
##  [3,]   12    1
##  [4,]   12   13
##  [5,]   13   14
##  [6,]   14    2
##  [7,]   14    3
##  [8,]   13   15
##  [9,]   15   16
## [10,]   16    4
## [11,]   16    5
## [12,]   15    6
## [13,]   11    7
## [14,]   10   17
## [15,]   17    8
## [16,]   17    9
tr$Nnode
## [1] 8
tr$tip.label
## [1] "KM027258_Human_2014/04/12" "KM027255_Human_2014"
## [3] "KM027261_Human_2014/04/15" "KM027259_Human_2014/04/14"
## [5] "KM027256_Human_2014"       "KM027260_Human_2014/04/21"
## [7] "KM027257_Human_2014/04/07" "KJ713296_Camel_2013/11"
## [9] "KJ713295_Camel_2013/11"
tr$edge.length
##  [1] 0.67659 0.12212 0.19232 0.04783 0.10851 0.02722 0.04420 0.03124
##  [9] 0.02702 0.09171 0.00408 0.13791 0.30074 0.28475 0.30305 0.30470
tr$node.label
## [1] "1.0"                 "1.0"                 "0.9876111111111111"
## [4] "0.1333888888888889"  "0.9997222222222222"  "0.1065"
## [7] "0.15838888888888888" "1.0"
Extract annotations
host <- tr$tip.label %>% strsplit(.,"_") %>% lapply(.,"[",2) %>% unlist
dd <- data.frame(taxa=tr$tip.label,host=host)
Plot using ape
The plotting function in ape only requires a single argument, the tree.
plot(tr)
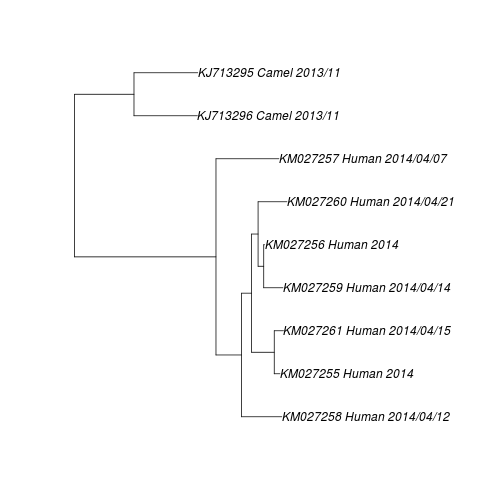
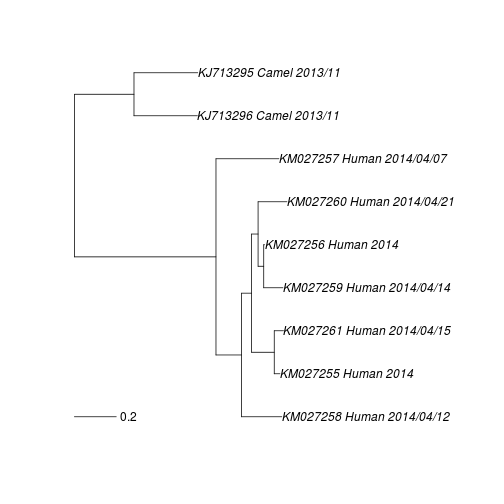
plot(tr)
add.scale.bar()
Generate ggtree and add annotations
g <- ggtree(tr,right=TRUE,time_scale=TRUE) %<+% dd
Plot tree
g+
  theme_tree2()+ # time scale
  geom_point(subset=.(isTip),aes(shape=host,color=host),size=4)+ # tip symbols
  geom_text(aes(color=host,label=host),hjust=-0.1)+ # tip labels
  xlim(0,1.2)+ # x scale
  xlab("Time") # x label
## Error in eval(expr, envir, enclos): could not find function "geom_point"